Case Study:
Transforming Data into Actionable Insights

Technologies Used:
Microsoft SQL Server
MicroStrategy Dossier
The Client
A US-based home improvement retail company
The Challenge
Develop a custom solution to unify and present crucial data; establish a system which analyses and visualises multi-dimensional data.
The Solution
A complete development of a unique store delivery BI dashboard that tracks each store’s effectiveness.
The Results
The dashboard developed in only 6 months; the client can now make better business moves; plan to build more business-critical dashboards.
Introduction
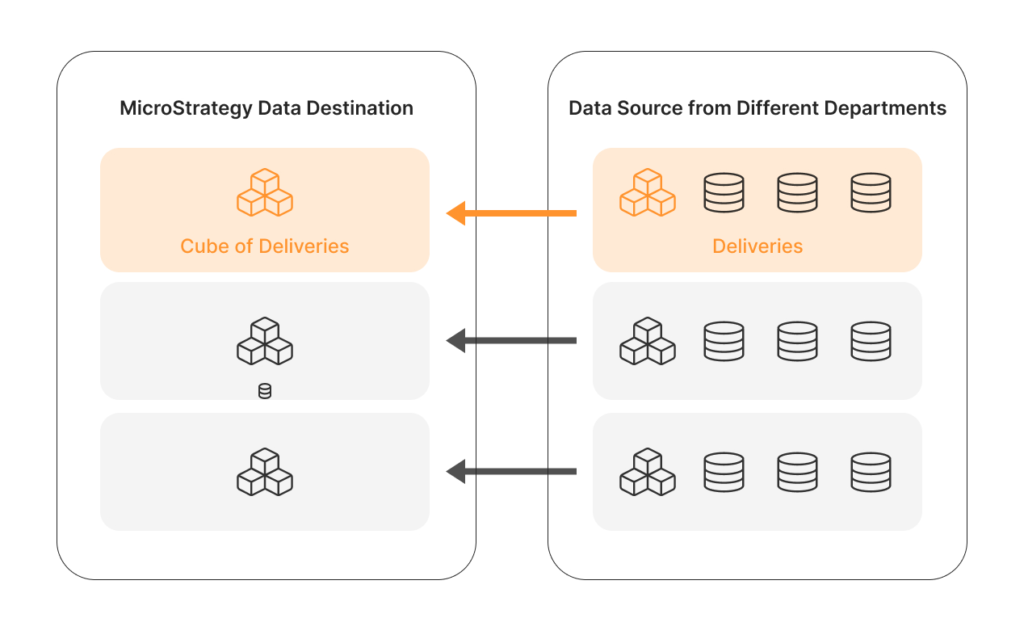
The customer is a US-based home improvement retail company. They reached out to us with a unique problem – they had accumulated a large amount of data they wanted to use to help them with business decisions. Namely, the customer has over 300 stores in the US, and each store collects data such as the number of deliveries, online/offline deliveries, deliveries by zone, etc. Although each store tracks crucial data, the major problem was that each store had its own database, and the customer didn’t have a unified solution to present it visually. This situation disrupted the customer’s growth and didn’t provide a real-time situation assessment.
Business Intelligence Development Kickoff
Initially, the customer needed a team of 3 people – 1 business analyst working on-site and 2 developers. We had to coordinate our work with the customer’s IT department and project managers. So, we included several Agile principles to inform every stakeholder about our work. Daily standup meetings, frequent project progress updates, and Q&A sessions were essential tools that helped us align our work with the customer’s needs.
The First Step - Find the Common Attributes in the Dataset
The team and the customer discussed the requirements and analysed the datasets collected from different stores and departments. The data blocks required further adjustments, and we tried several solutions. In the end, we chose MicroStrategy’s Dossier solution, which had several advantages over the other solutions we tested, such as:
- Comprehensive analytics: dashboards, data discovery, mobile, predictive analytics and transactions
- Extensive customization with workflows
- Open framework and unmatched extensibility with Rich APIs
- Object-oriented metadata that delivers a single version
- Architecture for flexible multitenant deployment
- Enterprise-grade performance and scalability
- Exceptional user experience with governed self-service
- Support for multiple platforms, multiple devices, multiple interfaces, and hundreds of data sources
- Comprehensive security with Single Sign-on (SSO) support
- Powerful automation and administration tools that reduce TCO
These advantages allowed us to visualise the data and maintain data connectivity, allowing our customer to build data with consistency and security in mind.
The Second Step – Develop the Store Delivery Dashboard
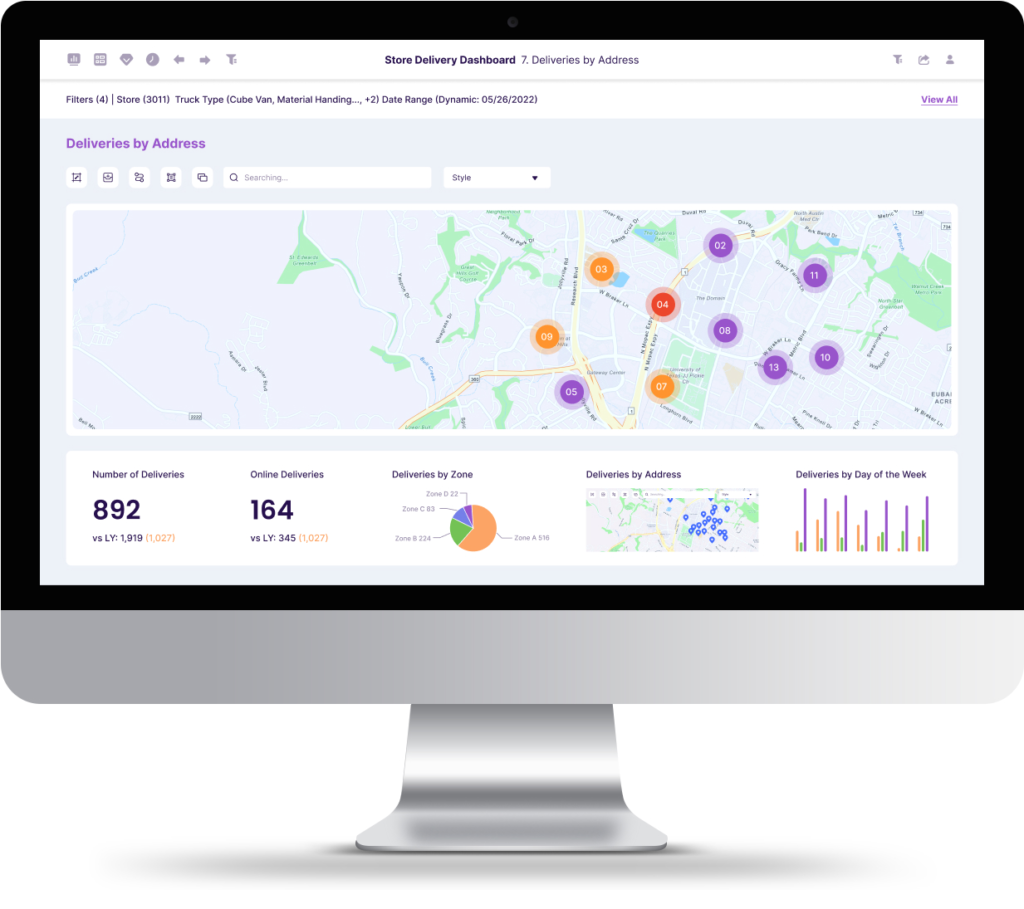
We focused our development efforts on creating a dashboard that managers and business analysts can intuitively understand. The dashboard consists of 8 main indicators that track data points in real-time. The indicators such as on-time deliveries, number of deliveries, online vs. in-person deliveries, etc. help our client to keep track of each store’s success as well as provide crucial data at a glance.
We used several modes to visualize the data. For example, the shipment volume in one week is represented with a bar, while pie charts reflect portions of daily deliveries.
We also included in the dashboard another crucial function – the actual transaction price change. This function follows price changes due to various reasons: lost goods, staff errors, damaged goods, etc. The customer can use this function to understand the situation of such abnormal problems and improve the subsequent management work.
Finally, we added several other tabular functions to help our customer make sense of the large amounts of data they collected over time. We included:
- delivery order amount,
- total delivery number,
- online transaction volume,
- failure to deliver on time.
This way of presenting data allows the customer to understand better the on-time delivery status of all partners they are currently cooperating with and improve these parameters.
How Shinetech Developers Bring Value to This Customer

We took several steps to facilitate working with the customer on this project. Firstly, the team moved the work 2 hours ahead to share work hours with the BA who was on-site. We also had an on-site BA working directly in the customer’s HQ. We also had frequent sychronization with the customer’s dev teams to ensure the project ran smoothly.
Regarding the software we were developing for the customer – we made sure the dashboard was intuitive for both technical and non-technical personnel.

We also included several filters to help the customer’s management refine their search and get exactly what they’re looking for.
We also made certain dashboard sections interactive – for example, the map that indicates high delivery volume is marked in red, followed by orange for medium delivery volume and blue for low delivery volume. Each manager can now access these locations and get more granular data.
The customer was satisfied with our work that they are now planning for us to develop another dashboard and bring three more developers to the team.
Meet the Team
Shinetech experts had previous experience in the automotive and retail industry, where they used Microstrategy solutions with a Germany-based retail brand and an Italian-based automotive giant.

Louis has 3 years of experience in the retail industry and 2 years in the automobile industry where he worked on projects for an Italian automotive giant. He has 5 years of experience in the professional development of BI development, especially in MicroStrategy.
Louis also has extensive experience with BI visualization tools like Tableau/PowerBI/FineBI.

Mike has over 5 years’ experience in BI Report development. He is also skilled in MSTR, Power BI, and SQL Server.
Mike is proficient with requirement analysis and development and experienced in web development. He has strong analytical and problem solving skills.

Louis has 3 years of experience in the retail industry and 2 years in the automobile industry where he worked on projects for an Italian automotive giant. He has 5 years of experience in the professional development of BI development, especially in MicroStrategy.
Louis also has extensive experience with BI visualization tools like Tableau/PowerBI/FineBI.

Mike has over 5 years’ experience in BI Report development. He is also skilled in MSTR, Power BI, and SQL Server.
Mike is proficient with requirement analysis and development and experienced in web development. He has strong analytical and problem solving skills.
Contact Us to Start Free Trial
We aim to reply as soon as we can. Instant reply? Call us now.


